5.9.2 Regress-panel - linear paneldata regression analysis
Linear paneldata analysis can be done through the regress-panel command. These are analyses where the dependent variable is of the continuous type or has rankable values, e.g. income or number of years of education.
Paneldata analyses are not currently available for modelling discrete outcomes (logistic paneldata analyses).
Syntax:
regress-panel <variable> <variable list> [if <condition>] [, <options>]
The dependent variable must be entered first, followed by the
explanatory variables. Options can be used for various purposes, such as robust or cluster estimation, cf. the sections below. Like other
statistical commands, regression commands can be combined with an if condition to run regressions on selected groups. For a full list of
options, use the help regress-panel command.
See section 2.4 on how to create datasets for paneldata analysis. A syntax script example is also presented there.
A number of paneldata analyses can be used, depending on what assumptions are made about the variability of the various variables over time. Common variants used are fixed effect and random effect analyses. These variants are available through options:
fe | fixed effect | Model where it is assumed that individual effects do not vary over time (within estimator). Here, the constant term will automatically control for all unobserved heterogeneity that is constant over time. The disadvantage is that fixed variables (measuring characteristics that do not vary over time, e.g. gender) are not allowed, and coefficient estimates for such variables will not be shown if they are included in the regression. re is used by default if no model options are selected. |
re | random effect | Model in which it is assumed that individual effects given by the constant term vary over time (GLS estimator). This model allows the estimation of coefficients for fixed variables. |
be | between effect | Model that uses the average of all variables measured over time, including the dependent variable (between estimator). That is, between effect models estimate cross-sectional variation based on average values measured over time. |
pooled | pooled | Model where time effects are disregarded, and the panel dataset is treated as a regular cross-sectional data set (pooled estimator). That is, ordinary linear regression (OLS) is performed on a panel dataset. Each individual will then be represented several times depending on the number of measurements. |
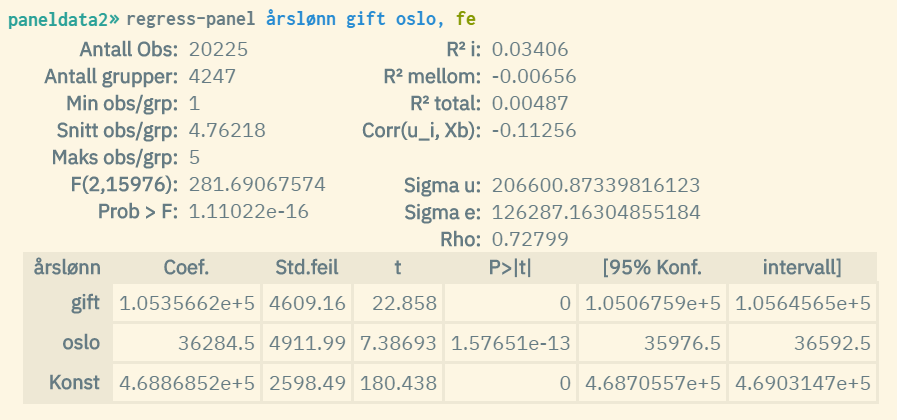
In the example below, annual salary (annual wage income) is used as a dependent variable, and dummy variables for marital status = married, and residence = Oslo are used as explanatory variables. In addition, five measurement dates are used: December 31. in the years 2011-2015. Population = all persons who completed a master's degree during the autumn semester 2010.
Example 1: Panel regression with fixed effects
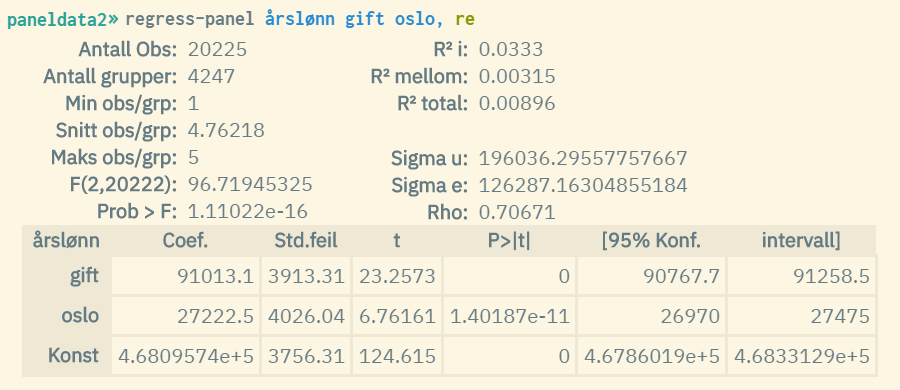
Example 2: Panel regression with random effects (same dataset as example 1)
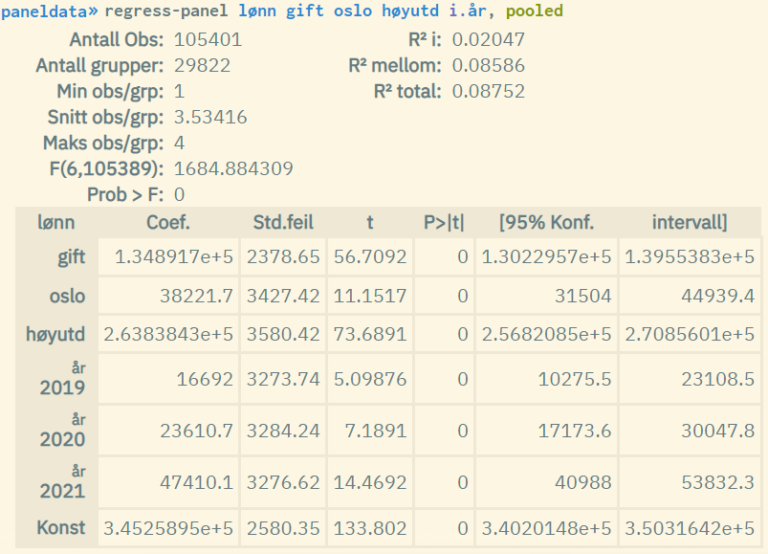
Example 3: Pooled panel regression
Factor variables, and cluster and robust estimation can also be used. The procedure is the same as for ordinary linear regression. See respectively chapter 5.4.1 and 5.4.3 for more information on this.
-
i = within: How much of the variance within the panel units does the model account for
-
mellom = between: How much of the variance between separate panel units does the model account for
-
total = overall: The overall measures the fit of the model ignoring any included effects. (The overall is a weighted average of the two above.)
-
Corr(u_i, Xb): Measures the correlation between the within entity errors and the regressors in the model. (Only reported for fixed effect models.)
-
Sigma u: Standard deviation of residuals within groups (not reported for pooled models)
-
Sigma e: Standard deviations of residuals (overall error term) (not reported for pooled models)
-
Rho: Fraction of variance due to (not reported for pooled models)
fe)?When carrying out a panel analysis with fixed effect estimation, a technique is used which removes the effect of time-constant variables. The fact that the estimates for the time-constant variables do not appear in the results is because they have been removed in the fixed effect estimation. This happens because the model assumes that these effects are captured in the error term, and thus do not affect the estimates for the other coefficients. Simply put, what one is interested in through fixed effect estimation is the effect of variables that change over time, not those that are constant.